Talking Points:
EUR/USD technical strategy:
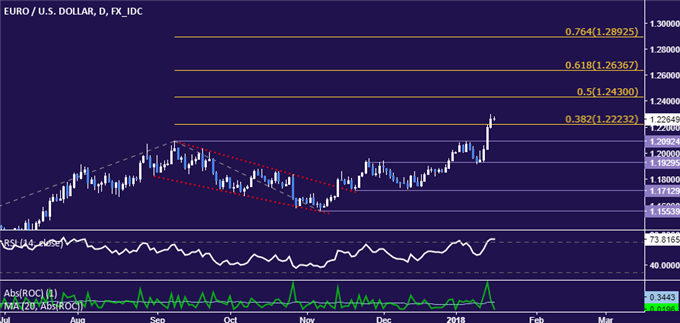
conflicting cuse argue against taking long or short position at this timeEuro aims above 1.24 after breaking yet another chart resistance level
The Euro has soared to the highest level in over three years against the US Dollar,
with a break past yet another layer of chart resistance hinting the
move upward will continue. Prices pulled back after showing a bearish
candlestick pattern as expected but the move quickly turned follow a hawkish ECB meeting minutes.
Standing aside seems prudent for now. Longer-term positioning
shows the Euro entering a critical resistance zone, arguing against
chasing the currency upward. On the other hand, the absence of a
clear-cut bearish reversal signal means that entering short is
premature, especially given recent bullish momentum.
From here, a daily close above the 50% Fibonacci expansion at
1.2430 opens the door for a challenge of the 61.8% level at 1.2637.
Alternatively, a move back below the 38.2% Fib at 1.2223 paves the way
for a retest of resistance-turned-support at 1.2092, the September 8
high.
What will drive the EUR/USD trend in the first quarter?

USD/JPY
Talking point:
USD/JPY has fallen and stay down
it's now closing in on what could be a key uptrend channelAUD/JPY has recovered, meanwhile, and looks set for more gains
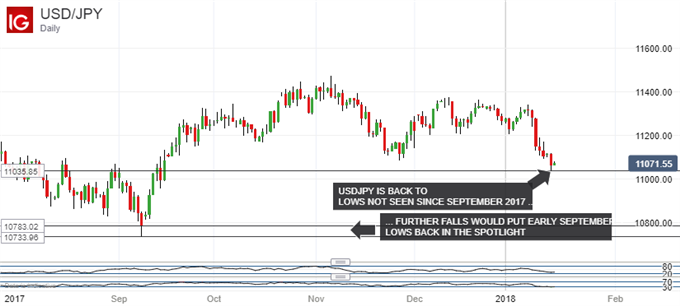
The Japanese Yen has posted strong gains against the US Dollar in the past week, taking USD/JPY back to lows not seen since mid-September last year.
The Yen has had a specific, domestic driver, too, even if its rationality is open to question. The Bank of Japan trimmed ever so slightly the amount
bought at its regular bond-market operations last week. This was seen
by the market as a sign that even Japan’s extraordinary accommodative
monetary policy could be tightened and the Yen duly rose. Now the Bank
of Japan has effectively denied the markets’ implicit charge since. It
has stuck to its ancient line that all current settings will remain in
place until inflation rises sustainably. But the Yen has not weakened,
suggesting perhaps that the markets do not wholly buy this line.
In all events, USD/JPY’s fall to the 110.24 region puts
early-September’s lows in the 107 region in focus, and they were the
lows for 2017 as a whole.
 3
3If we look a little further back for clues, we find USD/JPY now within striking distance of what could be a quite significant longer-term upward channel on its daily chart. This channel is rooted in the lows of September 2016. Its lower bound has quite a few validation points, not least the intraday low of November 9, 2016 which provided investors with a very broad daily range but a rather smaller actual gain.
Channel upside need hardly detain us long as a test of it looks most unlikely in the near term. However it is probably worth pointing out that that upside is necessarily bounded by the highs of late 2016 and early 2017. These look like outliers now, given the trading action before or since. A more valid channel top would probably take in the lower highs of March or even May 2017.
Still, the point is that this reasonably long-term uptrend will be
in serious trouble for the first time in its history if the Dollar
closes below 109.75. That is not very far from current levels.

Aussie bulls need to make progress above that January 10 fall, which means they need to retake 88.78, before moving on to an assault of the previous high, January 5’s 89.08. At the moment the Aussie seems to have enough tailwind to suggest that both levels could be tested. Official Chinese Gross Domestic Product data on Thursday could provide the fundamental impetus, especially if they show growth comfortably in the ‘better’ region of Beijing’s “6.5% or better” target. Analysts expectations centre around a 6.8% gain.
No comments:
Post a Comment