Long-Term Charts For Short-Term Currency Trades:
By Selwyn Gishen
stock trader often add currencies to portfolios, in order to benefit from the incredible opportunities that currency trading can present. While it is true that stock require a different set of analysis, there is enough in common between the two asset classes that should enable a stock trader to adapt quite easily to currency trading.Although the following method is designed as a swing trade that can be held for many days or weeks, it is also possible to use the tiger trading methodology to hold the position even longer, as long as the trade remains profitable.
Why the Tiger?
it seems that animal traits can be used quite effectively to describe human traders attributes. Let's not forget that bulls can make money, and so can bears but why the reference to the tiger? A tiger is a prodigious hunter and has the proverbial patience of a cat. it can sit and wait until the odds of a successful hunt are very high. For those traders with similar personality characteristics, trading the way a tiger hunts can be vary lucrative.
What Is a Long-Term Chart?
in order to be a tiger trader, investors need to position themselves so that the trade opportunity can best be seen from a distance, so to speak. To get the overview of the market and the way it has been trading, we should always look to the weekly chart.For stock market traders, the weekly chart may be a relatively short-term chart compared with monthly charts. However, in the forex markets weekly charts are considered long-term, from a trader's perspective.
Overview of a Tiger Trade
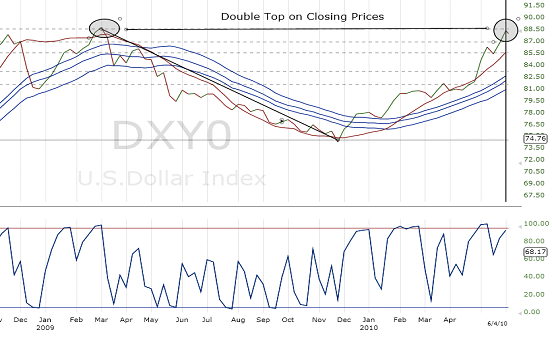
First, let's refer to the weekly chart of the DXY to see if price is approaching a pattern or a trend line, or a Fibonacci support or resistance line. in figure 1 (below), we use the towards the dollar. the price is approaching a "double top"
since the DXY or dollar index is made up of six currencies it offers a quick perspective of general dollar strenght or weakness.
What is Special About the Weekly Chart?
A weekly chart in the forex markets is the only time frame that shows a true close. the close is on Friday afternoon at 5pm EST, and the forex markets open again on sunday at 5pm EST. daily charts in the forex markets don't really close, although there is a settlement time, which change depending on which forex market you are trading in. For example, the New york closes at 5pm EST for settlement,and just one minute later, the market re-opens and all trading resmes. there is no overnight, because as soon as New york closes,Australia opens. Hence, Forex market trade 24 hours around the clock until Friday at 5pm EST.
Finding a Weekly Set-Up
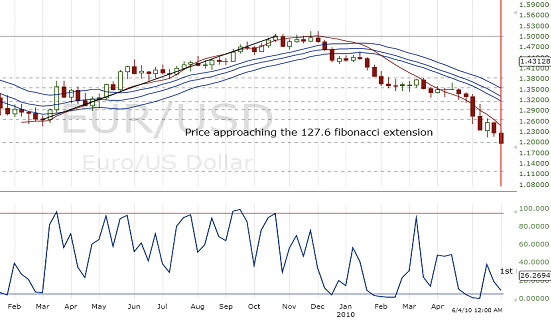
by scanning through all the major currencies, we notice that the weekly chart (figure 2) of the euro-dollar is approching the 127.6 Fibonacci extension. we could conclave that the coincidence, a double top in the one and a Fibonacci support level in the other, indicates a high-odds opportunit

.
A Tiger Personality:
Remember the tiger personality: it means the patience of a cat we need to be prepared to wait until all the "stars"are in alignment, namely the price is at an provide an opportunity to take a trade is pulling back to equilibrium, which will provide an opportunity to take a trade at a better price. if either of these two factors should occur, we can get ready to pounce
The Candlestick Chart:
At this point, it is also important to watch what happens at the 127 fibonacci line and to see what kind of candle pattern forms. usually, a hammer .spinning top or doji would be an indication of changing sentiment by the professional traders.

 .
.
No comments:
Post a Comment